Want to Learn More?
The Sculpture Hospitality Dashboard has been designed specifically for restaurant and bar owners to gain more visibility into the performance of their business, through insightful food and beverage inventory analytics.
That’s why you can access the dashboard at no additional cost to your current Sculpture Hospitality plan.
Don’t forget, our team of highly-experienced and local bar and restaurant inventory management specialists are here to help you every step of the way. Need help setting the Dashboard up or want to understand how you can dive into any of these analytics on a more granular level? They would love to help!
With Sculpture Hospitality’s specialized guidance, we work with your management team to help them become aware of how to minimize loss opportunities, tighten operational processes and thereby yield great results!

Whether you use the Sculpture Hospitality Dashboard yourself or you leverage the help of our locally-based experts, your restaurant or bar is sure to have all the analytics it needs to boost profitability.

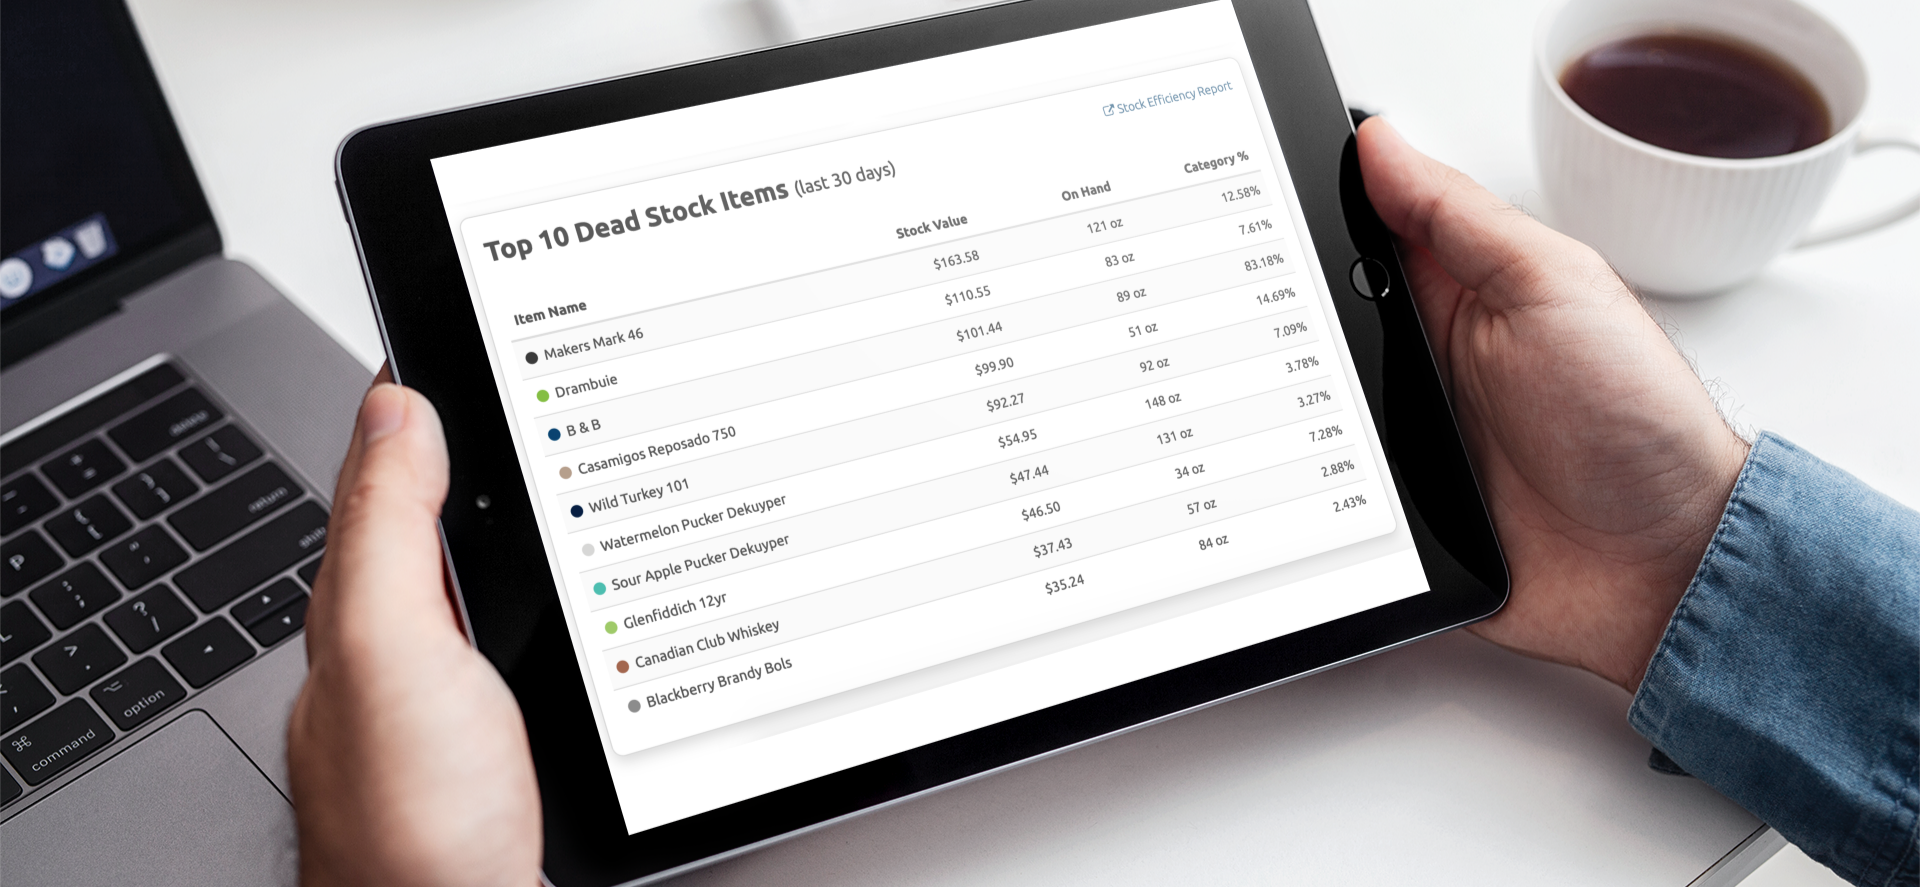

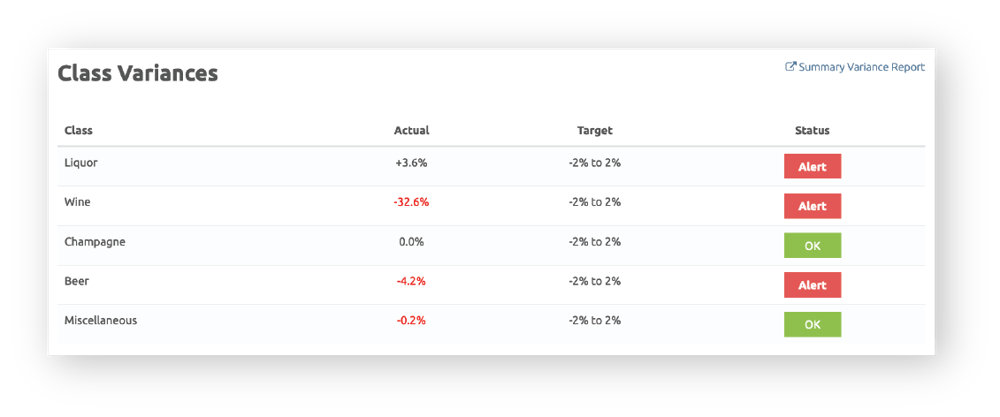
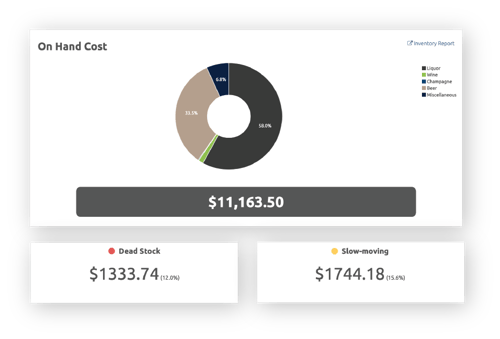 A Comprehensive View of How Your Inventory is Performing
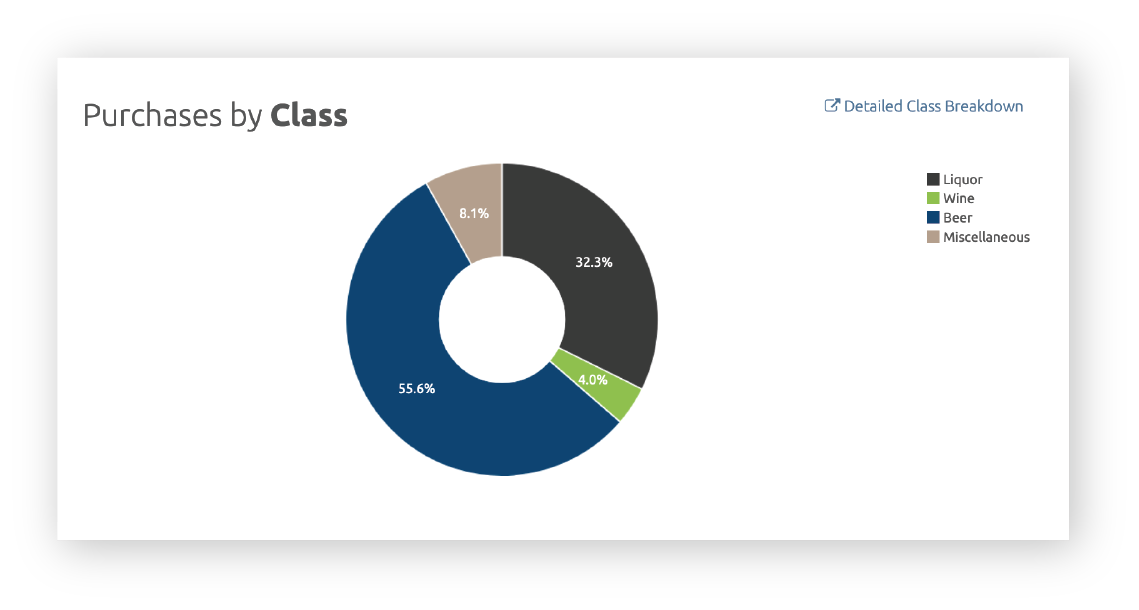
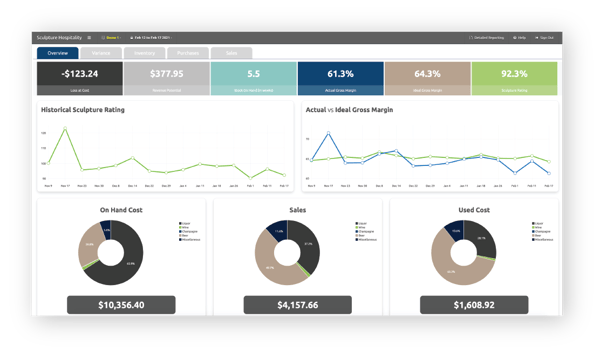
 Pull Valuable Insights From Your Point-of-Sale System
